
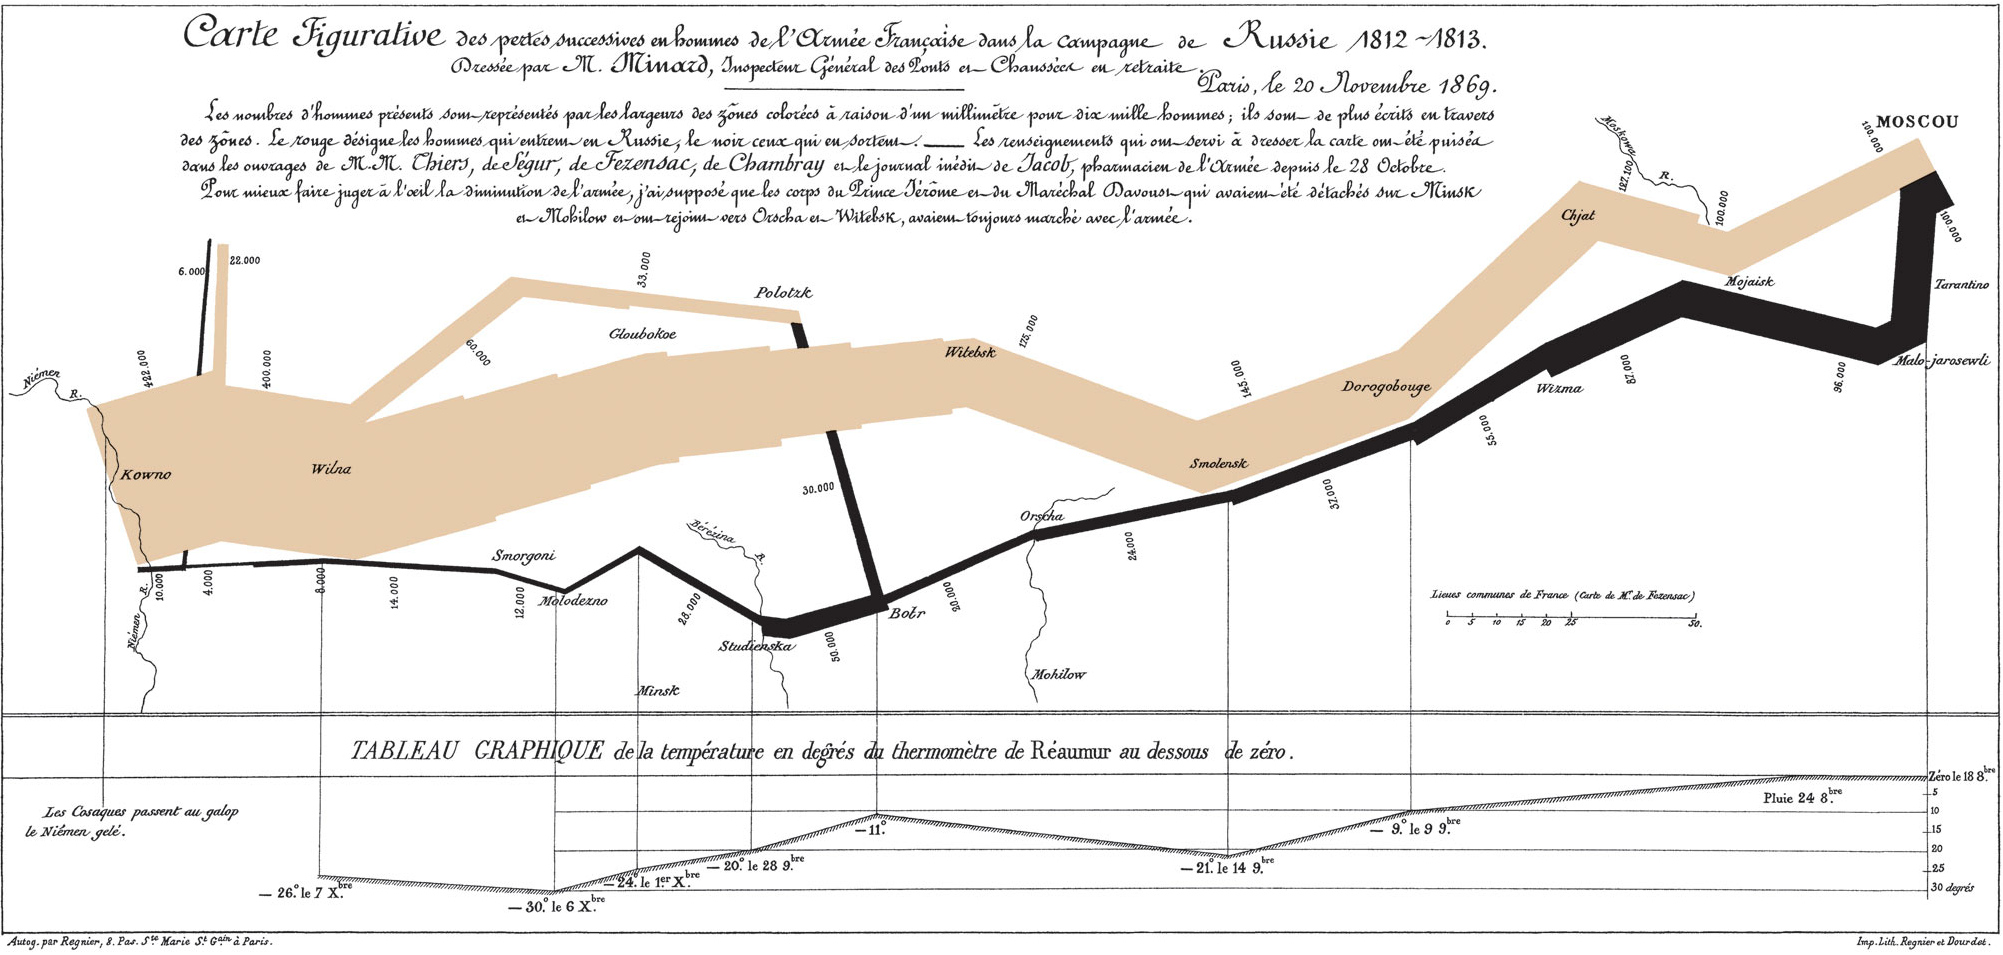

At the left of the map, a broad pale band begins beside the number 422,000. It crosses the page towards Moscow, becoming narrower as it goes. A black band brings the eye back west. By the time that returning route reaches its end, it is barely a thread.
The final label is 10,000.
The contrast is visible before most of the place names are readable. Charles-Joseph Minard has given a changing number a physical presence. The army occupies space on the page, and then loses it.
His map of the Russian campaign is dated 20 November 1869. The campaign named in its title is 1812–1813. This is a historical account assembled decades afterwards, not a map being updated beside the marching troops.
Its first impression is powerful. But the sheet rewards a slower journey through it: the meaning of width, the branches that leave and return, the thermometer underneath, and a revealing admission in Minard’s own caption.
A number became something you could see
Minard explains his rule above the route. The widths of the coloured bands represent the men present, with one millimetre standing for ten thousand men. He also writes numbers along the bands.
That double treatment matters. Width gives the immediate impression; a label provides a particular figure. The reader can notice a contraction without first performing subtraction, then inspect the numbers that make it concrete.
At Moscow, the outward band carries 100,000. Compare that with the 422,000 at the beginning. Much of the narrowing has happened before the black return journey begins.
There is a small trap in the millimetre rule. A map reduced for a book, or fitted to a phone screen, no longer has its original physical dimensions. Cartographer Menno-Jan Kraak discusses this in Mapping Time, his study of Minard’s map. The printed numbers remain useful when reproduction changes the scale.
So a ruler against this webpage would not recover Minard’s original measurement. The relationship between the wide and narrow bands survives, while their size on your particular screen changes.
The return journey reverses your reading
Begin with the pale route and travel from left to right towards Moscow. Then follow the black route from right to left. The same page carries an outward movement and a return, distinguished by colour.
Minard’s caption calls the outward colour red; it appears tan in this reproduction. Black identifies the men leaving Russia. The colours provide direction without a row of arrows telling the reader where to go.
Place names and rivers give that movement a setting. Smolensk, the Berezina and the Niemen are not arranged in a separate list. They sit within the changing shape. A number belongs to somewhere along a journey.
This gives the ribbon a job that an ordinary line graph would handle differently. The reader is following a route as well as a sequence of quantities. Its turns, crossings and branches help organise the account.
The broad pale band and the narrow black one also bring the beginning and ending close enough to compare at the same side of the page. There is no need to turn back through several pages to recover the starting figure.
Why can a shrinking army’s line get wider?
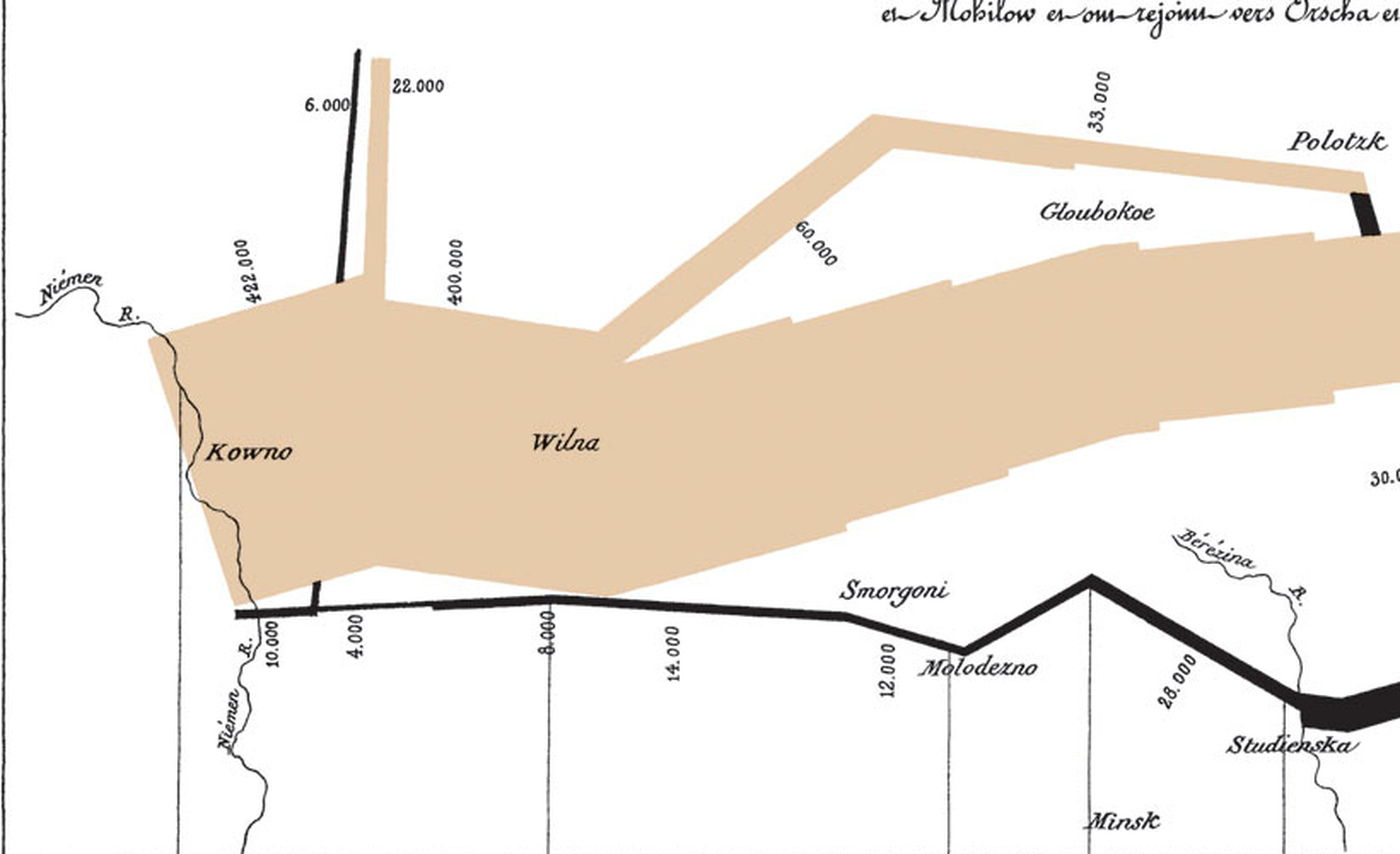
The map is more complicated than one band steadily dwindling. Smaller routes split off, and some join the main route again. A joining branch can make the returning line wider.
Look at the western end. The main black return is labelled 4,000 before a separate line marked 6,000 joins it. The resulting total is the 10,000 printed near the Niemen. The ending becomes easier to understand when those branches remain in view.
This is why a crop showing only the main ribbon can remove useful information. The separate route explains where part of the final width comes from. It also prevents the impression that every soldier followed one continuous track to Moscow and back.
These are Minard’s mapped figures for men present at particular points. They should not be turned into a subtraction that supposedly counts every person who died during the entire campaign. A change in the strength of a column and a count of deaths are different quantities.
The graphic makes an enormous reduction visible. The branches tell us to be careful about which group we are following while we read it.
The cold is underneath, but it is not the whole explanation
Below the route, Minard adds a temperature chart. Vertical lines connect the lower record with positions along the retreat. Dates sit beside readings. Like the black return, this part of the account runs from the right towards the left.
Its heading specifies degrees below zero on the Réaumur thermometer. The lowest labelled reading is 30 degrees below zero on 6 December. Those are the chart’s own units, not Celsius.
The arrangement lets the reader relate a place on the retreat to a dated temperature observation. Yet the horizontal position is still connected to the route. The spaces between locations do not become equal intervals of marching time simply because there is a graph underneath.
Kraak also cautions against treating the temperature record as the explanation for the entire disaster. The outward band has already contracted sharply before the retreat readings begin. The map connects quantities and conditions; it does not allocate every reduction to a cause.
That qualification strengthens the reading rather than spoiling the image. The cold is part of the account Minard chose to show. It cannot, by itself, explain every absence represented by the narrowing bands.
The most revealing decision is written above the picture
The small print names the histories Minard used, including works by Thiers, Ségur, Fezensac and Chambray, and an unpublished diary by the army pharmacist Jacob. The ribbon is a constructed account based on sources.
Then Minard describes a simplification. Troops under Prince Jérôme and Marshal Davoust had detached and later rejoined. To make the army’s diminution easier to judge, he treated those corps as though they had always marched with the army.
Some separate branches are still shown. His note does not say that every detachment has disappeared from the graphic. It identifies a particular choice about how to bring complicated movements into the main account.
That changes how we understand the smooth overall shape. It is not a complete tracing of every formation. Minard has made a judgement about what to combine so that the main reduction can be seen.
Crucially, the choice is disclosed on the sheet. The caption does more than name colours. It tells readers something about the construction of the evidence they are looking at.
The engineer had a second army on the sheet
Minard identifies himself as a retired Inspector General of Bridges and Roads. The École nationale des ponts et chaussées places his maps within a wider body of work, including transport, railway passengers and trade. Showing movement through changing quantities was a recurring concern.
The Napoleon graphic also belonged to a comparison. The Bibliothèque nationale de France catalogue records two maps on one sheet: the Russian campaign and Hannibal’s march from Spain towards Italy.
According to the École’s account, Minard deliberately used the same numerical scale for the two armies to make comparison easier. The shared rule concerned quantities of men. It did not make the two journeys the same length or the campaigns identical events.
Seen in that setting, the Russian map becomes more than a solitary, dramatic account. It is also part of a printed comparison, using a common visual measure to bring distant episodes together.
The version reproduced here shows the Russian campaign alone. Its full route, temperature record and caption are worth keeping together. The effect begins with a broad ribbon and a thin one, but the explanation lives in their relationship with everything around them.
Return to the left edge once more. The contrast between 422,000 and 10,000 is still striking. Now the little branch, the colour key and the word “present” have become part of what you see.
Sources
The original map, including its French caption, supplies the figures and the disclosed simplification. Kraak’s 2014 study provides cartographic analysis; the BnF catalogue and the École’s collection account establish the paired publication and wider context. The numbers here are presented as Minard’s mapped account, not as a newly verified military census.